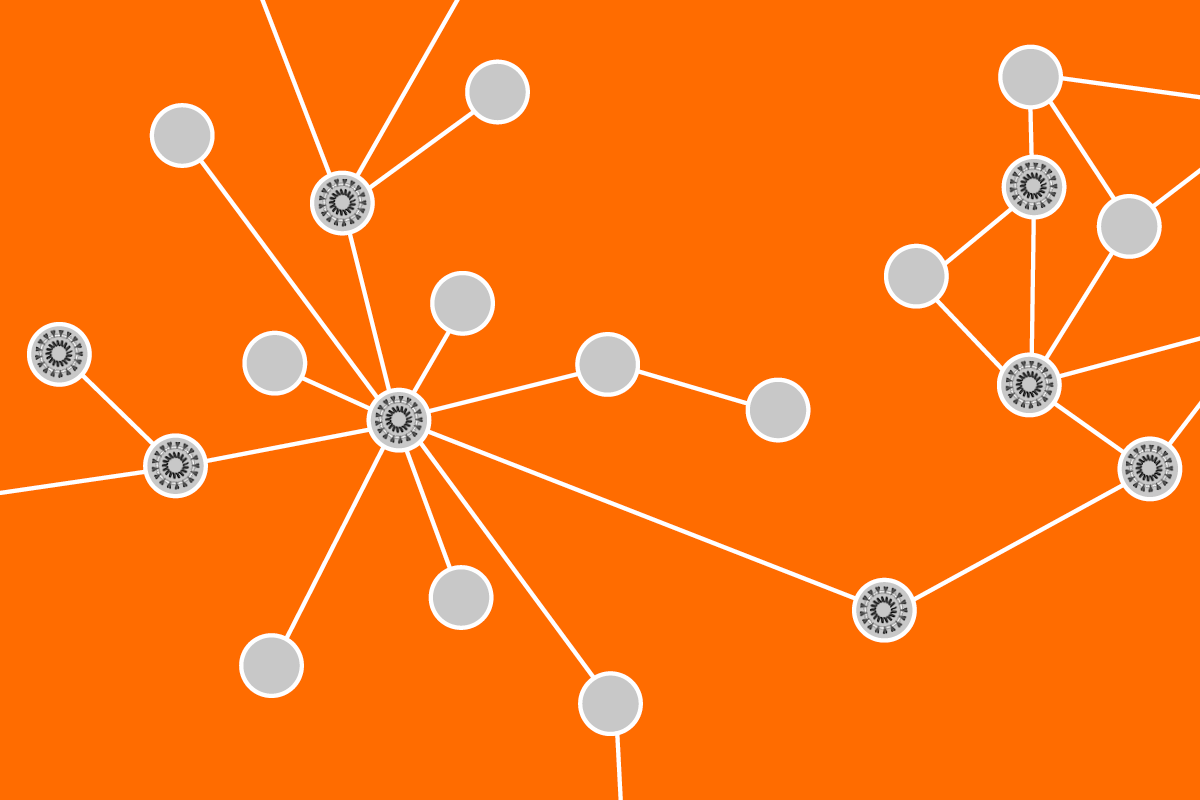
As COVID-19 consumes our attention, I couldn’t help but notice all of the ways this pandemic exemplifies the concepts CereMetrix is harnessing today. Our up-and-coming product, illumeai, is powered by graphs: data that is represented by objects and their relationships. With COVID-19, perhaps the easiest way to think about this is in terms of its spread. Let’s look at the graphic below.

A single infected person is represented by the red circle. Other, non-infected, susceptible people are represented by gray circles. When people interact with each other, a relationship is created by connecting the circles. As you can see, infection spreads through these interactions in the graph over time.
Graphs allow us to analyze the “connectedness” of data. With the COVID-19 example, some major questions can be answered with graphs:
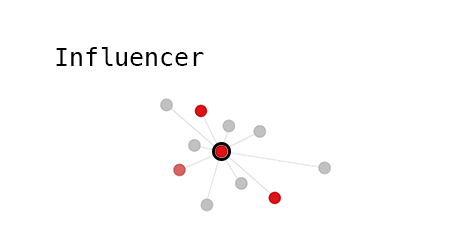
- Who is an influencer?
Influencers are people with the most connections. In a pandemic, this person could spread it to the most people. What makes them have so many relationships? Is it their jobs? Their social habits? The size of their family? Understanding influencers allows us to determine which actions best disrupt their connections and decrease their likelihood of infecting others.
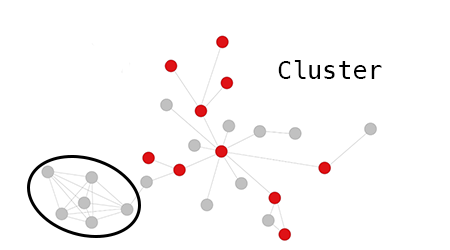
- Where might outbreaks happen?
COVID-19 can also spread where people share the same physical location for an extended period of time. This could be in a household, in a nursing home, in a place of worship, or in a workplace. These interactions form clusters of highly connected people; infect just one person and the virus could spread rapidly through the cluster. Understanding where clusters exist, particularly vulnerable ones, can help us think about how best to protect them.
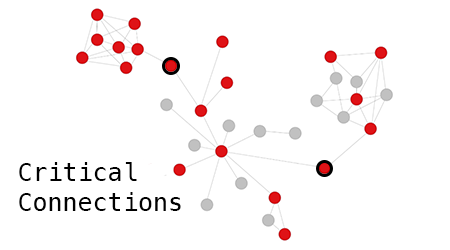
- Who is a critical connection to a vulnerable cluster?
You don’t have to be an influencer to be a critical connection. A person may not interact with anyone except their roommate but visits their elderly parent at a nursing home frequently. Their visits constitute a critical connection to a high-risk population. Understanding these connections and how to disrupt them could prevent outbreaks.
- How is the disease spread?
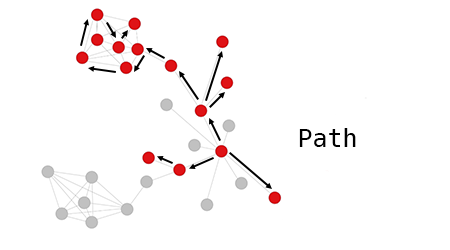
At the beginning of the pandemic, scientists learned about the novel virus from accidental outbreaks like the Diamond Princess cruise ship. Scientists investigated individuals with the virus and their interactions to follow the path of the infection as it spread aboard. Through this, scientists gained information about virus’ contagiousness, transmission, people’s risk factors, and the effectiveness of mitigation measures.
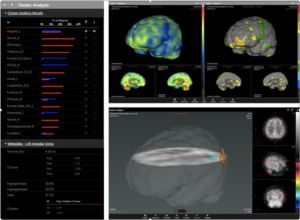
Important questions can be answered with graphs. At CereMetrix, we’re most interested in what the relationships between the patients in our database can tell us about brain health. What symptoms are shared? What brain imaging patterns are repeated? Do clusters of patients form around specific brain conditions, like traumatic brain injury? What are key characteristics that link patients together, or set them apart? The tools we’re building help us explore these questions more effectively through the use of graph technology. We envision these same tools to be just as effective in investigating the connectedness of any data – including COVID-19.
Lindsay Quandt
Senior Medical Imaging Engineer